“Unless someone like you cares a whole awful lot, nothing is going to get better, it’s not.”The Lorax, Dr. Seuss, 1971
Morongo Indian Reservation & Climate Change
What is Climate Change?
Climate change is any significant long-term change in the expected patterns of average weather of a region (or the whole Earth) over a significant period of time. Climate change is about abnormal variations to the climate, and the effects of these variations on other parts of the Earth. Global climate is the average climate over the entire planet. The planet is warming up fast—faster than at any time scientists know about from their studies of Earth’s entire history.
Global climate is the average climate over the entire planet. The planet is warming up fast—faster than at any time scientists know about from their studies of Earth’s entire history.
Climate V. Weather
“Climate” describes conditions over the long term and over an entire region.
Ex. Southern California also has a dry, desert climate.
“Weather” happens at a particular time and place.
Ex. Rain, snow, wind, hurricanes, tornadoes—these are all weather events (local and temporary)

This graph, based on the comparison of atmospheric samples contained in ice cores and more recent direct measurements, provides evidence that atmospheric CO2 has increased since the Industrial Revolution. (Credit: Vostok ice core data/J.R. Petit et al.; NOAA Mauna Loa SCO2 record.) Find out more about ice cores (external site). Source: https://climate.nasa.gov/faq/

Morongo’s Climate, Topography, and Precipitation
The reservation is located within the transitional zone between the southwest Mediterranean climate and southeast Sonoran Desert climate. Mediterranean climate is characterized by hot summers and cool, moist winters. Sonoran Desert climate is characterized by very hot summers and mild winters. The average temperature is approximately 64 degrees Fahrenheit but temperatures frequently exceed 100 degrees Fahrenheit in the summer months.
Elevations on the reservation range from 5,620 feet in the foothills of the San Bernardino Mountains to 1,400 feet at the eastern end of the San Gorgonio Pass. Because of the variations in climate and elevation, precipitation patterns also vary seasonally and annually with higher elevations generally receiving more precipitation than lower elevation areas. In general, a majority of the annual precipitation falls between November and March. The 30-year average rainfall for the Pass area is 15 inches of precipitation annually. Mountain areas have an average annual precipitation of 23 inches. Average annual humidity is typically in the 50-60% range due to the presence of a shallow marine layer.
Morongo’s Vulnerability to Climate Change
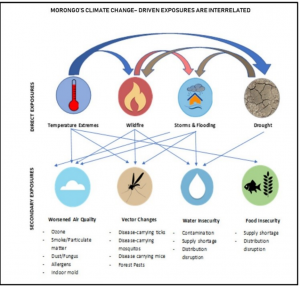
Due to Morongo’s location, it has been found that there are 4 direct exposures that will negatively impact the reservation as well as the resulting secondary exposures. If these exposures aren’t addressed then there could great consequences that could compromise the future of the reservation.
- Elevated Temperature
- Worsened air ozone levels
- Food insecurity
- Vector changes
- Wildfire
- Worsened particulate matter in air (smoke)
- Water insecurity
- Vector changes
- Storms and Flooding
- Worsened indoor mold in air
- Water insecurity
- Vector changes
- Drought
- Water insecurity
- Worsened dust & fungus particles and allergens in the air
Current Adaptation Strategies
- Elevated Temperature
- Air Quality Index (AQI) aka Flag Program
- Provide assistance for elders
- Wildfire
- Fire Department (on-site & off-site)
- System of firebreaks
- Morongo EPD monitors forest health
- Identifying stressors for plants
- Storms & Flooding
- Flow control through road closures
- Maintained annually and activities have taken place to remove floatable debris, effort to reduce future debris flow and clogged culverts
- Drought
- Morongo Water Department monitors drinking water
- Water Department maintains four groundwater recharge ponds to aid in groundwater recovery
Proposed Adaptation Strategies
- Elevated Temperature
- Establish cooling centers
- Prepare for extreme heat and possible risk of wildfires
- Expand the AQI flag program to include a notification system for employees, particularly grounds keepers, to notify supervisors of poor air quality days and recommended measures to protect employee health
- Wildfire
- Maintain existing firebreaks
- Create defensible barriers between homes, buildings, Promote property upkeep (dry, weedy plants)
- Develop seed bank, plant at higher elevation, Establish community gardens
- Promote general fire safety measures in the community such as camp fire safety, implementing burning ban days, and fireworks safety, in collaboration with the Morongo Fire Department
- Storms & Flooding
- Incorporate more conservative floodplain design principles to prevent loss of life and property due to increased risks of flooding as a result of climate change. Incorporate policies and codes into the planning process.
- Homes on the reservation should be elevated above the floodplain level, adopt building codes
- Culverts should be increased to allow for additional flow during heavy rain events
- Drainage ditches, storm water drains, and berms can be installed along roads to prevent debris flows onto roadways and flooding on Martin Road
- Residents should purchase flood insurance, Conduct community outreach on the topic of flood preparedness
- Drought
- Improve & expand existing groundwater recharge ponds; add additional water tank
- Install water meters and enforce water conservation measures
- Educate community members on water conservation strategies including low flow devices, rain barrels, and drought
tolerant landscaping - Plant drought tolerant vegetation near streams to reduce evaporation
- Use recycled water from the Tribe’s wastewater treatment plant for landscape irrigation
Further Resources
Throughout the report, information sources are cited in footnotes. These include local, state, and national reports; databases; studies and literature generated by Morongo, such as its Tribal Hazard Mitigation Plan; environmental assessments; and resource management reports. Where possible, this report prioritized information that was specific to the Morongo Indian Reservation. In many cases, the most useful data was only available at a county or larger scale and relies on information provided by credible California State or federal agencies, where a high degree of accuracy is likely. However, this report cannot verify the accuracy of all data.
Climate change projections for the Morongo Indian Reservation were estimated utilizing the California Climate Console – web-based application. The tool utilizes historical climate data from 1971-2000 from the Parameter-elevation Relationships on Independent Slopes Model (PRISM) 30 arc-second spatial climate dataset for the Conterminous United States. Future climate projections are based upon 10 models proven to simulate historical climate conditions in the southwestern United States. Climate projections were downscaled to California and projections averaged over time periods 2016-2045 and 2046-2075 for each model. An average of all ten models for each time period was also calculated and displayed as the multi-model ensemble mean. For the purposes of this assessment, the area analyzed in the California Climate Console tool was set to “User Defined” and a square large enough to encompass the entirety of the Morongo Indian Reservation was selected on the web application map. For each variable (precipitation, maximum temperature, minimum temperature, aridity, and potential evapotranspiration) the“Multi-Model Ensemble Mean” was selected as the climate model type, which displays an average of all ten climate model projections for the variable for each time period.
Data and projections in published reports and Cal-Adapt were also utilized to support data collected from the California Climate Console and provide additional information.
- Conservation Biology Institute [CBI]. (2016). California Climate Console (online web application). http://climateconsole.org/ (accessed September 2017).
- You can further look at the models and figures used to estimate the changes in temperature, rainfall, aridity, and evapotranspiration in our area.
- State of California Governor’s Office of Planning and Research, Energy Commission and Natural Resources Agency, California’s Fourth Climate Change Assessment: Statewide Summary Report (2018), http://www.climateassessment.ca.gov/state/docs/20180827-StatewideSummary.pdf
- This gives an overview of the projected changes for the entire state if California.
- State of California Governor’s Office of Planning and Research, Energy Commission and Natural Resources Agency, California’s Fourth Climate Change Assessment: Inland Deserts Region Report (2018), https://www.energy.ca.gov/sites/default/files/2019-07/Reg%20Report-%20SUM-CCCA4-2018-008%20InlandDeserts.pdf
- This gives a more specific and centralized look at the projected climate changes for the Inland Desert Region, which is where the Morongo Indian Reservation is located.